Simulation Logging
This guide provides instructions on how to access and interpret the simulation logs. The SimMonitor class outputs a telemetry file and an event log, which can be visualized using the provided visualize_log.py script or replayed using the provided replay_log.py script. To aggregate logs from multiple runs kicked off using a run configuration, we have provided a process_run.py script.
Overview

Simulation logs capture detailed telemetry and event data from each simulation run. These logs are essential for debugging, performance analysis, and understanding the behavior of agents within the simulation. The SimMonitor class is responsible for:
- Collecting agent state data at some logging frequency.
- Writing telemetry data to
sim_telemetry_*.binand converting the binary file tosim_telemetry_*.csv. - Recording significant events to
sim_events_*.csv. - Organizing logs into timestamped directories for each simulation run.
Logs are exported to the Logs directory in your operating system's persistent data path.
| Operating System | Log directory |
|---|---|
| Windows | C:\Users\<user>\AppData\LocalLow\BAMLAB\micromissiles\Logs |
| Mac | ~/Library/Application Support/BAMLAB/micromissiles/Logs |
| Linux | ~/.config/unity3d/BAMLAB/micromissiles/Logs |
Log Directory
Simulation logs are organized into timestamped directories within the Logs directory. Each simulation run generates a new subdirectory with the timestamp of the run, and each simulation configuration produces two CSV files:
- Telemetry file (
sim_telemetry_*.csv): Contains detailed state information for each agent at each time step. The telemetry CSV file is converted from an accompanyingsim_telemetry_*.binbinary file. - Event log (
sim_events_*.csv): Records significant events such as hits, misses, agent creation, and termination.
If the simulation run was executed interactively through the Unity Editor or through the command line without a run configuration provided, the logs will be stored in a directory called run_<timestamp>. Each engagement scenario will produce one telemetry file and one event log, so loading a new simulation configuration or restarting the simulation configuration generates additional CSV files.
Logs/
  ├── run_20251117_095849/
  │   ├── sim_telemetry_20251117_095849.bin
  │   ├── sim_telemetry_20251117_095849.csv
  │   ├── sim_events_20251117_095849.csv
  │   │
  │   │   # Corresponds to a different simulation configuration in the same simulation run.
  │   ├── sim_telemetry_20251117_095912.bin
  │   ├── sim_telemetry_20251117_095912.csv
  │   └── sim_events_20251117_095912.csv
  ├── run_20251117_105038/
  │   ├── sim_telemetry_20251117_105038.bin
  │   ├── sim_telemetry_20251117_105038.csv
  │   └── sim_events_20251117_105038.csv
  │
  └── ...
If the simulation run was executed through the command line with a run configuration provided, the logs will be stored in a parent directory called <run_config_name>_<timestamp>. The logs of each simulation run are then stored in subdirectories within this parent directory, called run_<run_index>_seed_<seed>. Since a run configuration is provided, the simulation does not automatically restart on conclusion, so there are only two CSV files per subdirectory.
Logs/
  ├── batch_7_quadcopters_20251117_095849/
  │   ├── run_1_seed_200/
  │   │   ├── sim_telemetry_20251117_095849.bin
  │   │   ├── sim_telemetry_20251117_095849.csv
  │   │   └── sim_events_20251117_095849.csv
  │   ├── run_2_seed_201/
  │   │   ├── sim_telemetry_20251117_095902.bin
  │   │   ├── sim_telemetry_20251117_095902.csv
  │   │   └── sim_events_20251117_095902.csv
  │   └── ...
  │
  ├── batch_5_swarms_100_ucav_20251117_105038/
  │   ├── run_1_seed_100/
  │   │   ├── sim_telemetry_20251117_105038.bin
  │   │   ├── sim_telemetry_20251117_105038.csv
  │   │   └── sim_events_20251117_105038.csv
  │   ├── run_2_seed_101/
  │   │   ├── sim_telemetry_20251117_105228.bin
  │   │   ├── sim_telemetry_20251117_105228.csv
  │   │   └── sim_events_20251117_105228.csv
  │   └── ...
  │
  └── ...
Telemetry File
The telemetry file provides a snapshot of the simulation at each time step for every agent. Key columns include:
Time: Simulation time at the snapshot.AgentType: Type of the agent, e.g.,CarrierInterceptor,MissileInterceptor,FixedWingThreat, orRotaryWingThreat.AgentID: Unique identifier for each agent, e.g.,Micromissile_Interceptor_6orQuadcopter_Threat_2.PositionX,PositionY,PositionZ: Position of the agent.VelocityX,VelocityY,VelocityZ: Velocity of the agent.
Event Log
The event log records significant events within the simulation. Key columns include:
Time: Simulation time when the event occurred.Event: Type of event, e.g.,NEW_INTERCEPTOR,NEW_THREAT,INTERCEPTOR_HIT,INTERCEPTOR_MISS,INTERCEPTOR_DESTROYED,THREAT_HIT, orTHREAT_DESTROYED.AgentType: Type of the agent, e.g.,CarrierInterceptor,MissileInterceptor,FixedWingThreat, orRotaryWingThreat.AgentID: Unique identifier for each agent, e.g.,Micromissile_Interceptor_6.PositionX,PositionY,PositionZ: Position where the event occurred.
Log Visualizer
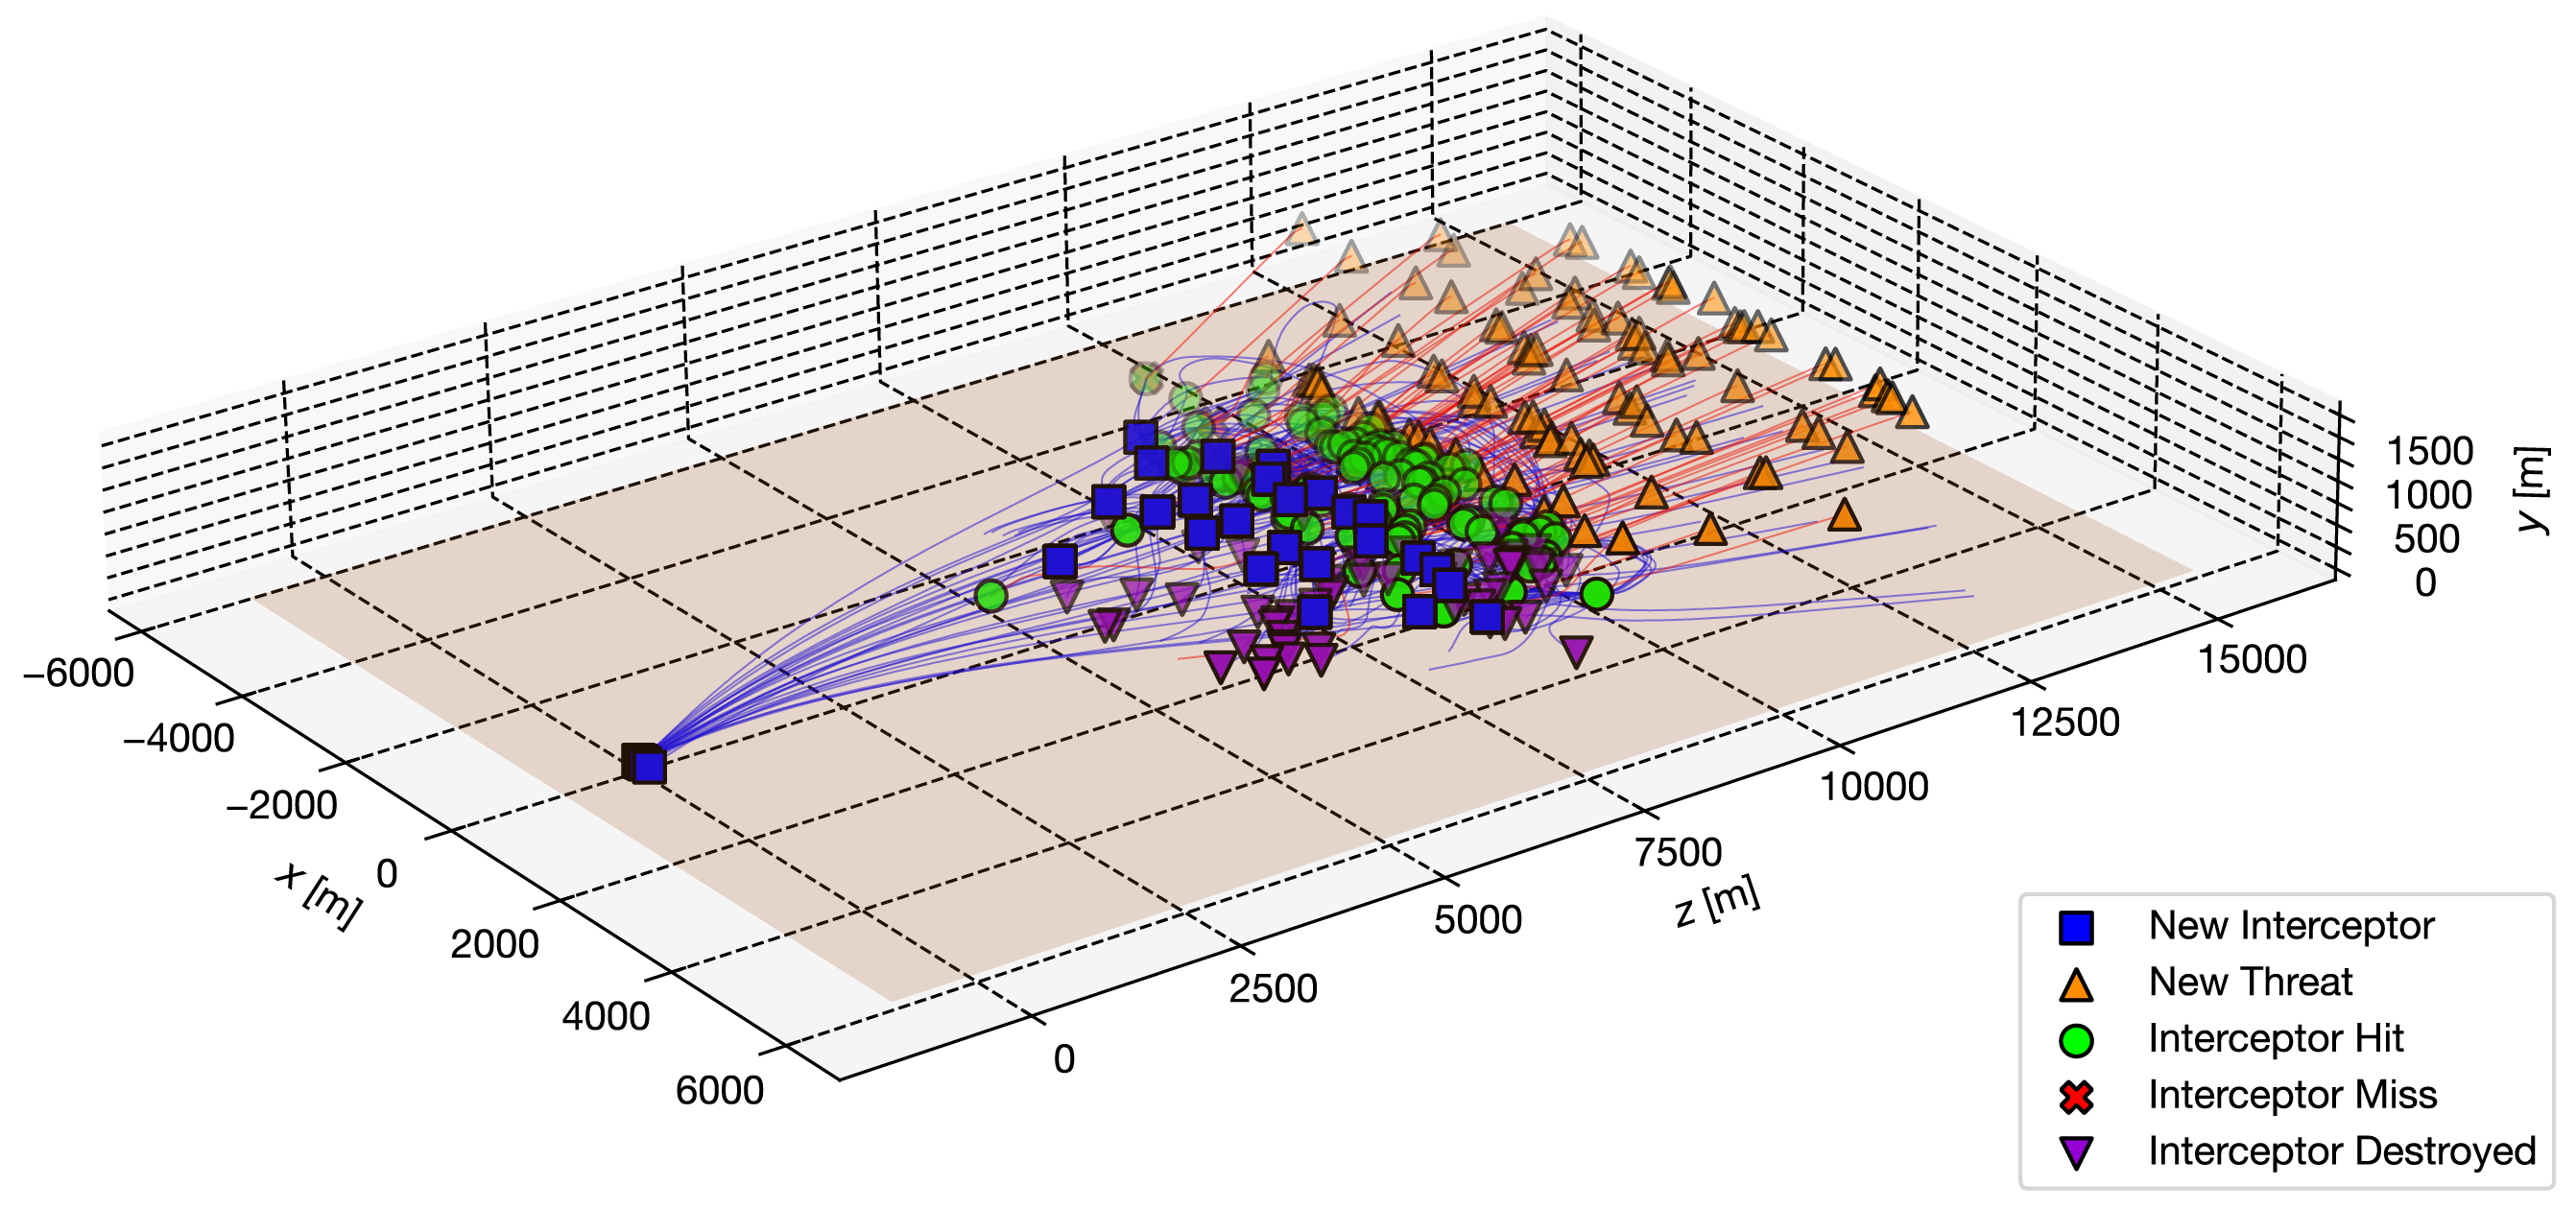
visualize_log.py is an example script provided to help visualize the agent trajectories and events in a 3D plot. It is included in the Tools directory of the release.
Requirements
To run visualize_log.py, ensure that you have Python 3 installed on your system and that you have the following Python libraries:
absl-pymatplotlibnumpypandas
Visualizing the Log
Run the script as follows:
python3 Tools/visualize_log.py \
    --telemetry_file path/to/sim_telemetry_file.csv \
    --event_log path/to/sim_events_file.csv
If either the telemetry file or the event log is not provided, the script will automatically locate the most recent sim_telemetry_*.csv and sim_events_*.csv files within the provided --log_search_dir. If --log_search_dir is not provided, it defaults to the persistent data path.
The script then outputs a summary of the events, including the total number of interceptor hits and misses.
Total number of events: 490.
Event counts:
  NEW_INTERCEPTOR: 170
  NEW_THREAT: 100
  THREAT_DESTROYED: 100
  INTERCEPTOR_HIT: 100
  INTERCEPTOR_MISS: 20
Total duration of events: 45.72 seconds (from 0.00 to 45.72).
Number of interceptor hits recorded: 100.
  First hit at 15.77, last hit at 45.72.
Number of interceptor misses recorded: 20.
  First miss at 16.55, last miss at 45.59.
Finally, the script plots the agent trajectories and marks events, such as interceptor hits and misses, in a 3D plot.
Telemetry Replay
replay_log.py is an example script provided to replay the telemetry file and interactively visualize all agent trajectories in a 3D web animation. It is included in the Tools directory of the release.
Requirements
To run replay_log.py, ensure that you have Python 3 installed on your system and that you have the following Python libraries:
absl-pypandas
Replaying the Log
Run the script as follows:
python3 Tools/replay_log.py \
    --telemetry_file path/to/sim_telemetry_file.csv \
    --output path/to/animation.html
If the telemetry file is not provided, the script will automatically locate the most recent sim_telemetry_*.csv file within the provided --log_search_dir. If --log_search_dir is not provided, it defaults to the persistent data path.
The script generates an HTML file containing an interactive 3D animation of the telemetry file and outputs it to the given output file path. The HTML file can be opened in any web browser to view the animation.

Run Processor
If the simulation run was kicked off using a run configuration, you can use the provided process_run.py script to aggregate metrics across multiple simulation runs and analyze and visualize them. process_run.py is included in the Tools directory of the release.
Requirements
To run process_run.py, ensure that you have Python 3 installed on your system and that you have the following Python libraries:
absl-pymatplotlibnumpypandas
Processing a Run
Run the script as follows:
python3 Tools/process_run.py --run_log_dir path/to/run_log_directory_20251117_095849If --run_log_dir is not provided, the script will automatically locate the most recent subdirectory within the provided --run_log_search_dir. If --run_log_search_dir is not provided, it defaults to the persistent data path.
The script then aggregates the events for all telemetry files and event logs found within the log directory and its subdirectories.
Aggregating the stats for 50 runs found in the log directory.
  Number of missile interceptors: mean: 150.360000, std: 13.805448.
  Number of missile interceptor hits: mean: 99.840000, std: 0.611882.
  Number of missile interceptor misses: mean: 36.360000, std: 14.784803.
  Missile interceptor hit rate: mean: 0.741564, std: 0.077913.
  Missile interceptor efficiency: mean: 0.669430, std: 0.059498.
  Minimum intercept distance: mean: 6154.423782, std: 1283.849098.
Each statistic is implemented as a Metric, which is evaluated on each simulation run.
- A
ScalarMetricis a single numerical output from a single simulation run, such as the number of interceptors, the number of hits and misses, and the minimum intercept distance. - A
MultiMetricoutputs a list of an arbitrary type from a single simulation run, such as all intercept positions. These metrics are then aggregated and analyzed for all simulation runs.
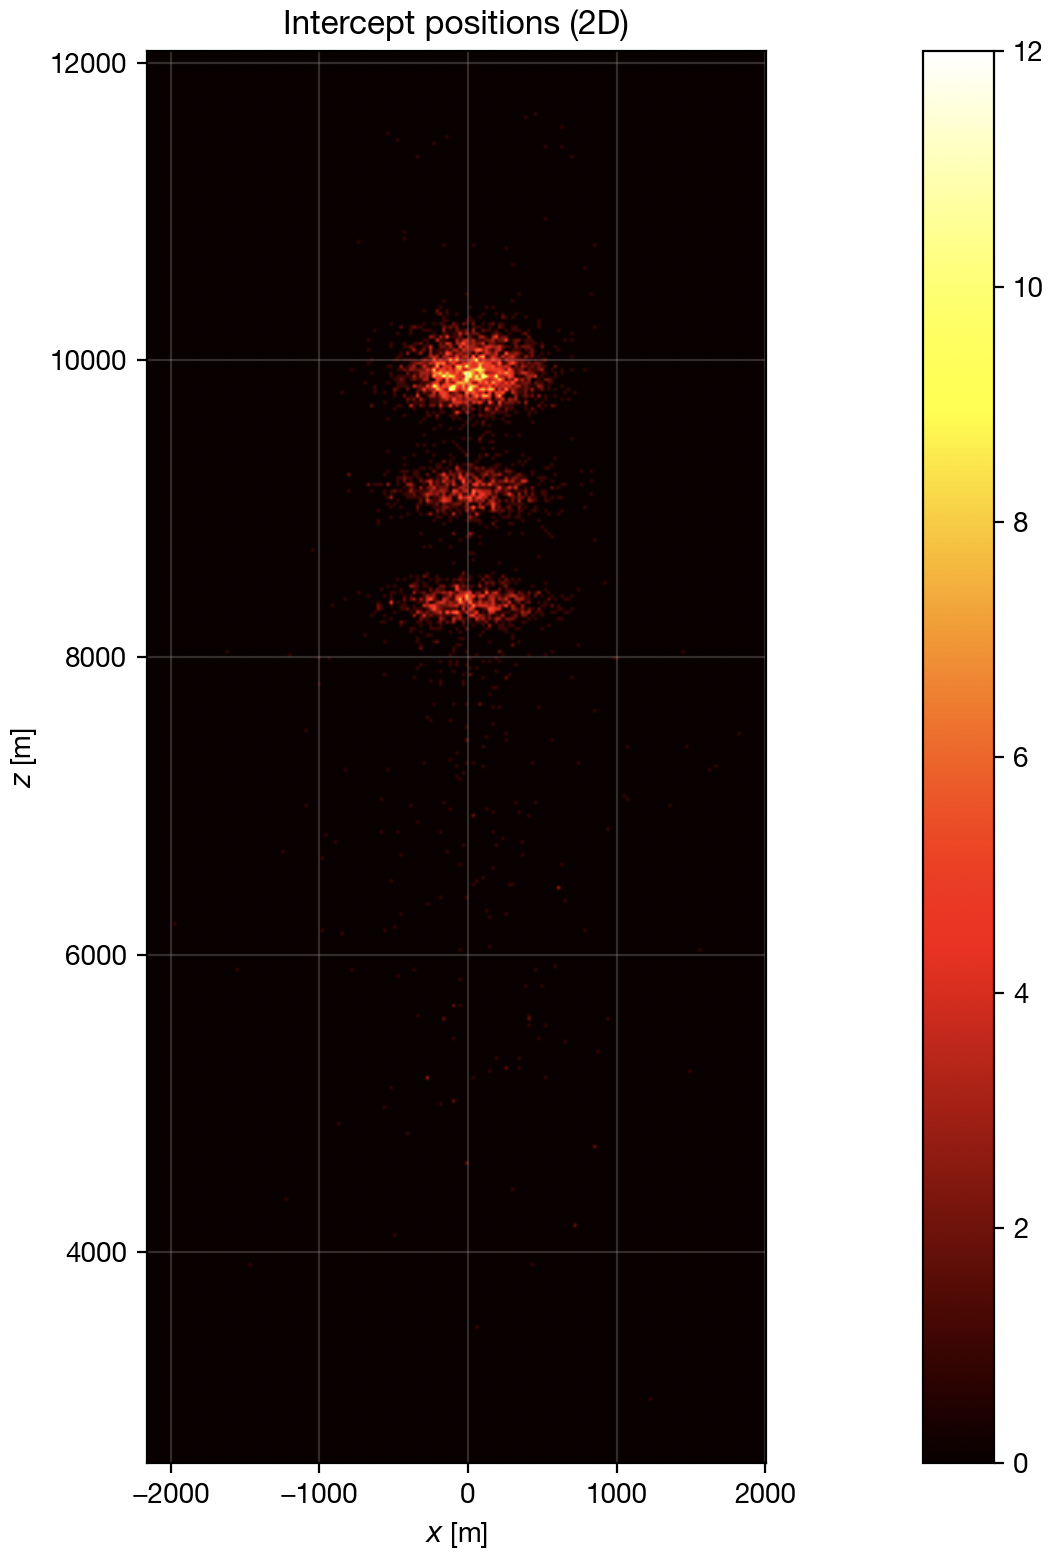
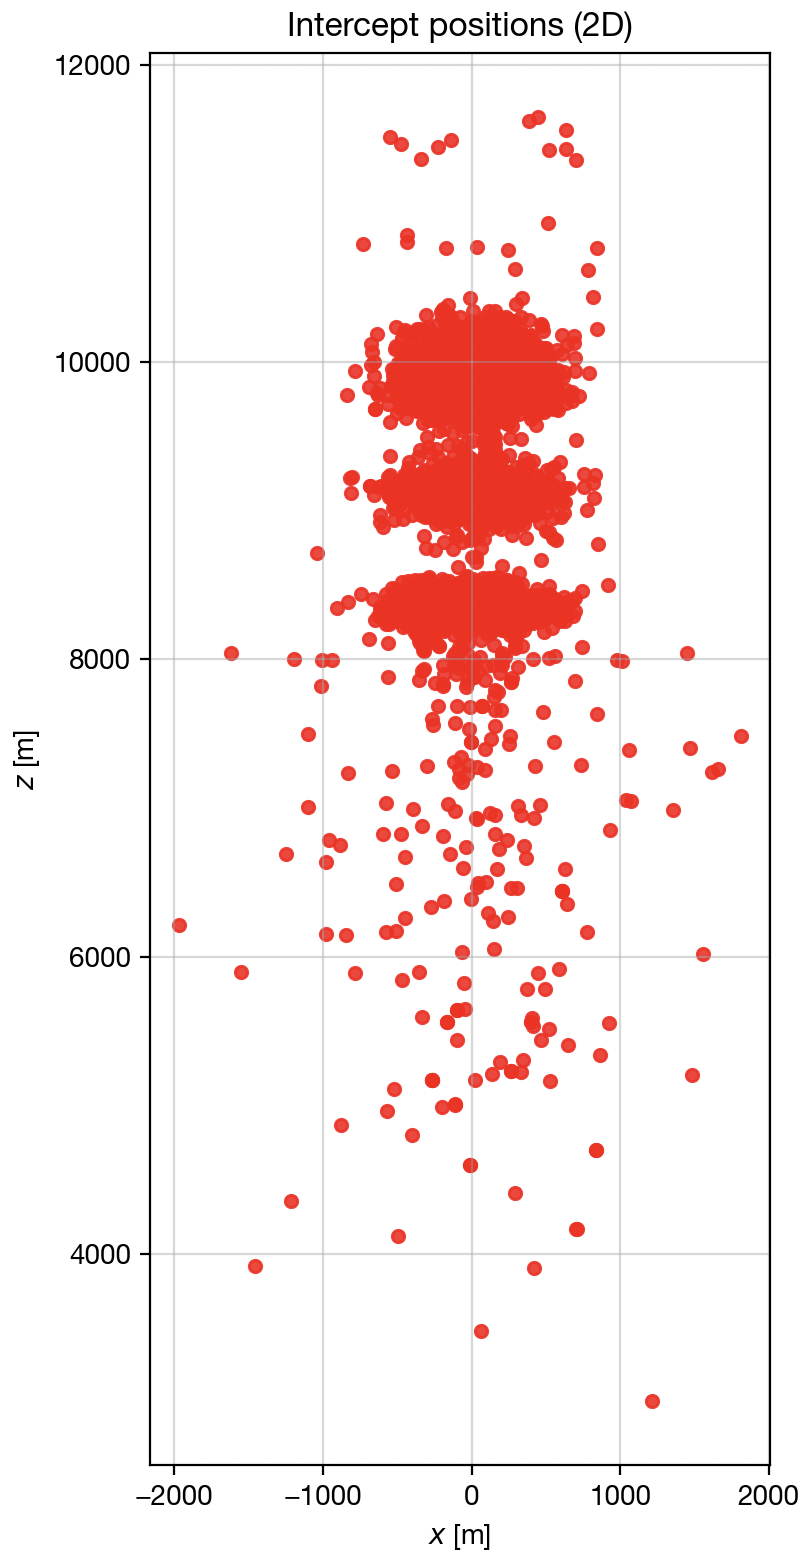
process_run.py also plots a heatmap and a scatter plot of the 2D intercept positions (ignoring elevation).
| Heatmap | Scatter Plot |
|---|---|
 |  |